
If it was decided to say hold Sydney does that mean XR members in Melbourne who do not want to travel to Sydney miss out - do they just stay home? Melbourne has a large progressive population and there were if I remember rightly up to 20,000 on the streets for the Jan 10 bushfire protests. It seems the energy and numbers are there - it might just be a matter of organising and harnesing it?
I think the idea is not so much to disrupt specfic companies or politcians but to bring major cities to a halt and cause financial disruption. This then creates a dilema for the government where they either enact draconian measures - thereby producing in thoery a backlash effect - or they meet our demands. It is the dilema created by blockading major CBD’s (the finacial and business hubs of the country) that then forces the government into a corner where they have to act. That is my understanding of the strategy.
I think we should take into account a balance of factors here. Here I’ve played with a bunch of the data to look at how different targeting scenarios might impact participation.
Data
Here’s Australia’s population listed by State / Territory (not counting overseas territories):
| State | Postal | Capital | Population | Percentage | Cumulative |
|---|---|---|---|---|---|
| (Jun 2019)[3] | |||||
| New South Wales | NSW | Sydney | 8,089,526 | 31.899% | 31.899% |
| Victoria | VIC | Melbourne | 6,594,804 | 26.005% | 57.903% |
| Queensland | QLD | Brisbane | 5,095,100 | 20.091% | 77.994% |
| Western Australia | WA | Perth[n 2] | 2,621,680 | 10.338% | 88.332% |
| South Australia | SA | Adelaide | 1,751,693 | 6.907% | 95.240% |
| Tasmania | TAS | Hobart | 534,281 | 2.107% | 97.346% |
| Australian Capital Territory | ACT | Canberra | 426,709 | 1.683% | 99.029% |
| Northern Territory | NT | Darwin | 245,869 | 0.970% | 99.998% |
Here’s a map of Australian population centers:
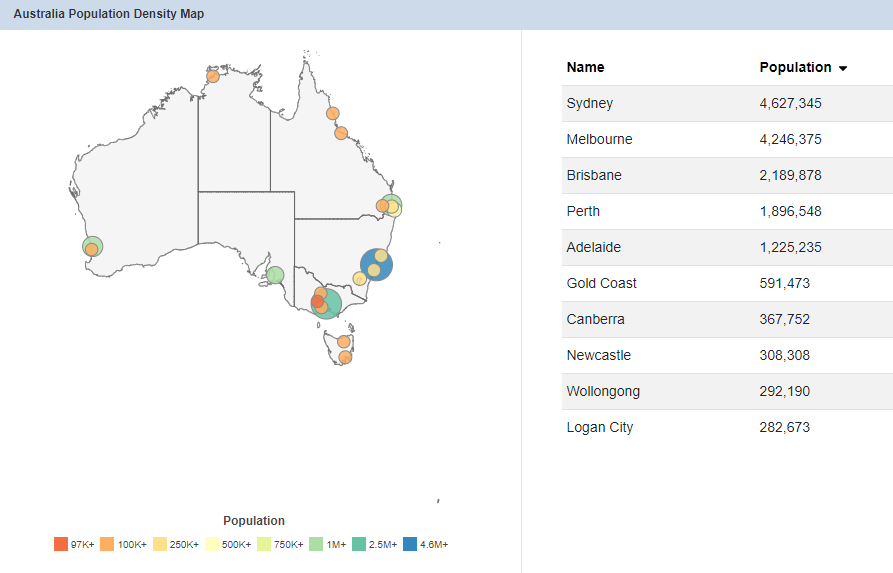
And here’s a list of urban population centers with a population over 10,000 from Wikipedia (data from June 2018 Census):
| Rank | GCCSA/SUA | State/Territory | June 2018[2] | 2011 Census[3] | Growth | Percentage of | Cumulative Percentage |
|---|---|---|---|---|---|---|---|
| Population | national population (June 2018) | ||||||
| 1 | Sydney | New South Wales | 5,230,330 | 4,391,674 | 19.10% | 20.93% | 20.93% |
| 2 | Melbourne | Victoria | 4,936,349 | 3,999,982 | 24.08% | 19.86% | 40.79% |
| 3 | Brisbane | Queensland | 2,462,637 | 2,065,996 | 19.20% | 9.85% | 50.64% |
| 4 | Perth | Western Australia | 2,059,484 | 1,728,867 | 19.12% | 8.24% | 58.88% |
| 5 | Adelaide | South Australia | 1,345,777 | 1,262,940 | 6.56% | 5.38% | 64.26% |
| 6 | Gold Coast–Tweed Heads | Queensland/New South Wales | 679,127 | 557,822 | 21.75% | 2.72% | 66.98% |
| 7 | Newcastle–Maitland | New South Wales | 486,704 | 398,770 | 22.05% | 1.95% | 68.93% |
| 8 | Canberra–Queanbeyan | Australian Capital Territory/New South Wales | 457,563 | 391,645 | 16.83% | 1.83% | 70.76% |
| 9 | Sunshine Coast | Queensland | 333,436 | 270,770 | 23.14% | 1.33% | 72.09% |
| 10 | Wollongong | New South Wales | 302,739 | 268,944 | 12.57% | 1.21% | 73.30% |
| 11 | Geelong | Victoria | 268,277 | 173,454 | 54.67% | 1.07% | 74.37% |
| 12 | Hobart | Tasmania | 232,606 | 211,656 | 9.90% | 0.93% | 75.30% |
| 13 | Townsville | Queensland | 180,820 | 162,292 | 11.42% | 0.72% | 76.02% |
| 14 | Cairns | Queensland | 152,729 | 133,911 | 14.05% | 0.61% | 76.63% |
| 15 | Darwin | Northern Territory | 148,564 | 120,586 | 23.20% | 0.59% | 77.22% |
| 16 | Toowoomba | Queensland | 136,861 | 105,984 | 29.13% | 0.55% | 77.77% |
| 17 | Ballarat | Victoria | 105,471 | 91,801 | 14.89% | 0.42% | 78.19% |
| 18 | Bendigo | Victoria | 99,122 | 86,079 | 15.15% | 0.40% | 78.59% |
| 19 | Albury–Wodonga | New South Wales/Victoria | 93,603 | 82,083 | 14.03% | 0.37% | 78.96% |
| 20 | Launceston | Tasmania | 87,382 | 82,220 | 6.21% | 0.35% | 79.31% |
| 21 | Mackay | Queensland | 80,148 | 77,293 | 3.69% | 0.32% | 79.63% |
| 22 | Rockhampton | Queensland | 78,592 | 73,681 | 6.67% | 0.31% | 79.94% |
| 23 | Bunbury | Western Australia | 74,363 | 65,608 | 13.34% | 0.30% | 80.24% |
| 24 | Coffs Harbour | New South Wales | 71,822 | 64,243 | 11.80% | 0.29% | 80.53% |
| 25 | Bundaberg | Queensland | 70,921 | 67,341 | 5.32% | 0.28% | 80.81% |
| 26 | Wagga Wagga | New South Wales | 56,442 | 52,042 | 8.45% | 0.23% | 81.04% |
| 27 | Hervey Bay | Queensland | 54,674 | 48,680 | 12.31% | 0.22% | 81.26% |
| 28 | Mildura–Wentworth | Victoria/New South Wales | 51,903 | 47,536 | 9.19% | 0.21% | 81.47% |
| 29 | Shepparton–Mooroopna | Victoria | 51,631 | 46,505 | 11.02% | 0.21% | 81.68% |
| 30 | Port Macquarie | New South Wales | 47,973 | 41,723 | 14.98% | 0.19% | 81.87% |
| 31 | Gladstone–Tannum Sands | Queensland | 45,130 | 41,966 | 7.54% | 0.18% | 82.05% |
| 32 | Tamworth | New South Wales | 42,872 | 38,735 | 10.68% | 0.17% | 82.22% |
| 33 | Traralgon–Morwell | Victoria | 41,984 | 39,705 | 5.74% | 0.17% | 82.39% |
| 34 | Orange | New South Wales | 40,493 | 36,468 | 11.04% | 0.16% | 82.55% |
| 35 | Bowral–Mittagong | New South Wales | 39,887 | 34,858 | 14.43% | 0.16% | 82.71% |
| 36 | Busselton | Western Australia | 38,921 | 30,286 | 28.51% | 0.16% | 82.87% |
| 37 | Dubbo | New South Wales | 38,392 | 33,997 | 12.93% | 0.15% | 83.02% |
| 38 | Warragul–Drouin | Victoria | 37,928 | 29,944 | 26.66% | 0.15% | 83.17% |
| 39 | Geraldton | Western Australia | 37,648 | 35,749 | 5.31% | 0.15% | 83.32% |
| 40 | Nowra–Bomaderry | New South Wales | 37,420 | 33,338 | 12.24% | 0.15% | 83.47% |
| 41 | Bathurst | New South Wales | 36,801 | 32,479 | 13.31% | 0.15% | 83.62% |
| 42 | Warrnambool | Victoria | 35,214 | 32,380 | 8.75% | 0.14% | 83.76% |
| 43 | Albany | Western Australia | 34,205 | 30,656 | 11.58% | 0.14% | 83.90% |
| 44 | Devonport | Tasmania | 30,297 | 29,051 | 4.29% | 0.12% | 84.02% |
| 45 | Kalgoorlie–Boulder | Western Australia | 29,849 | 30,842 | −3.22% | 0.12% | 84.14% |
| 46 | Mount Gambier | South Australia | 29,639 | 27,756 | 6.78% | 0.12% | 84.26% |
| 47 | Lismore | New South Wales | 28,720 | 28,285 | 1.54% | 0.11% | 84.37% |
| 48 | Nelson Bay | New South Wales | 28,051 | 25,074 | 11.87% | 0.11% | 84.48% |
| 49 | Maryborough | Queensland | 27,282 | 26,214 | 4.07% | 0.11% | 84.59% |
| 50 | Burnie–Wynyard | Tasmania | 27,174 | 26,869 | 1.15% | 0.11% | 84.70% |
| 51 | Alice Springs | Northern Territory | 26,534 | 25,186 | 5.35% | 0.11% | 84.81% |
| 52 | Victor Harbor–Goolwa | South Australia | 26,532 | 23,850 | 11.25% | 0.11% | 84.92% |
| 53 | Ballina | New South Wales | 26,381 | 23,509 | 12.22% | 0.11% | 85.03% |
| 54 | Taree | New South Wales | 26,381 | 25,421 | 3.78% | 0.11% | 85.14% |
| 55 | Morisset–Cooranbong | New South Wales | 25,309 | 21,774 | 16.23% | 0.10% | 85.24% |
| 56 | Armidale | New South Wales | 24,504 | 22,464 | 9.08% | 0.10% | 85.34% |
| 57 | Goulburn | New South Wales | 23,835 | 21,484 | 10.94% | 0.10% | 85.44% |
| 58 | Whyalla | South Australia | 21,742 | 21,991 | −1.13% | 0.09% | 85.53% |
| 59 | Gympie | Queensland | 21,599 | 19,510 | 10.71% | 0.09% | 85.62% |
| 60 | Echuca–Moama | Victoria | 21,242 | 19,309 | 10.01% | 0.08% | 85.70% |
| 61 | Forster–Tuncurry | New South Wales | 21,159 | 19,500 | 6.51% | 0.08% | 85.78% |
| 62 | Griffith | New South Wales | 20,251 | 17,900 | 13.13% | 0.08% | 85.86% |
| 63 | Wangaratta | Victoria | 19,318 | 17,686 | 9.23% | 0.08% | 85.94% |
| 64 | St Georges Basin–Sanctuary Point | New South Wales | 19,251 | 12,611 | 52.65% | 0.08% | 86.02% |
| 65 | Grafton | New South Wales | 19,078 | 18,359 | 3.92% | 0.08% | 86.10% |
| 66 | Yeppoon | Queensland | 19,003 | 16,372 | 16.07% | 0.08% | 86.18% |
| 67 | Murray Bridge | South Australia | 18,779 | 16,708 | 12.40% | 0.08% | 86.26% |
| 68 | Mount Isa | Queensland | 18,588 | 20,569 | −9.63% | 0.07% | 86.33% |
| 69 | Camden Haven | New South Wales | 17,835 | 15,741 | 13.30% | 0.07% | 86.40% |
| 70 | Broken Hill | New South Wales | 17,734 | 18,517 | −4.23% | 0.07% | 86.47% |
| 71 | Moe–Newborough | Victoria | 16,812 | 16,674 | 0.83% | 0.07% | 86.54% |
| 72 | Karratha | Western Australia | 16,708 | 16,476 | 1.41% | 0.07% | 86.61% |
| 73 | Horsham | Victoria | 16,514 | 15,894 | 3.90% | 0.07% | 86.68% |
| 74 | Batemans Bay | New South Wales | 16,485 | 15,733 | 4.78% | 0.07% | 86.75% |
| 75 | Singleton | New South Wales | 16,346 | 16,135 | 1.31% | 0.07% | 86.82% |
| 76 | Port Lincoln | South Australia | 16,326 | 15,221 | 7.26% | 0.07% | 86.89% |
| 77 | Ulladulla | New South Wales | 16,213 | 14,149 | 14.59% | 0.06% | 86.95% |
| 78 | Bairnsdale | Victoria | 15,411 | 13,243 | 16.37% | 0.06% | 87.01% |
| 79 | Warwick | Queensland | 15,380 | 14,607 | 5.29% | 0.06% | 87.07% |
| 80 | Kempsey | New South Wales | 15,309 | 14,494 | 5.62% | 0.06% | 87.13% |
| 81 | Sale | Victoria | 15,021 | 14,258 | 5.35% | 0.06% | 87.19% |
| 82 | Ulverstone | Tasmania | 14,490 | 14,109 | 2.70% | 0.06% | 87.25% |
| 83 | Broome | Western Australia | 14,445 | 12,766 | 13.15% | 0.06% | 87.31% |
| 84 | Port Hedland | Western Australia | 14,320 | 13,772 | 3.98% | 0.06% | 87.37% |
| 85 | Port Pirie | South Australia | 14,188 | 14,043 | 1.03% | 0.06% | 87.43% |
| 86 | Emerald | Queensland | 14,119 | 13,219 | 6.81% | 0.06% | 87.49% |
| 87 | Port Augusta | South Australia | 13,799 | 13,658 | 1.03% | 0.06% | 87.55% |
| 88 | Lithgow | New South Wales | 12,973 | 12,249 | 5.91% | 0.05% | 87.60% |
| 89 | Colac | Victoria | 12,547 | 11,778 | 6.53% | 0.05% | 87.65% |
| 90 | Mudgee | New South Wales | 12,410 | 10,483 | 18.38% | 0.05% | 87.70% |
| 91 | Muswellbrook | New South Wales | 12,364 | 11,791 | 4.86% | 0.05% | 87.75% |
| 92 | Esperance | Western Australia | 12,145 | 11,432 | 6.24% | 0.05% | 87.80% |
| 93 | Parkes | New South Wales | 11,224 | 10,941 | 2.59% | 0.04% | 87.84% |
| 94 | Swan Hill | Victoria | 11,103 | 10,430 | 6.45% | 0.04% | 87.88% |
| 95 | Portland | Victoria | 10,900 | 10,715 | 1.73% | 0.04% | 87.92% |
| 96 | Kingaroy | Queensland | 10,398 | 9,808 | 6.02% | 0.04% | 87.96% |
I added the last column onto that chart, to give a bit of an indication how much of the national population has been accounted for as you scroll down the chart. You can see that once you’ve counted the first 20 or so cities you really start to see smaller and smaller gains, with almost 80% of the national population situated within the top 20 urban centers. From the 21st city onwards you to the 96th (Kingaroy, population 10,398), you have 8.3% of the national population, and over half of that are in NSW or Victoria.
Now, of those top 20, all are within 11 hours drive of Sydney and Melbourne with the exception of Perth, Hobart, Townsville, Cairns, Darwin, and Launceston.
So, from all of this, we can say that all of NSW and Vic (57% of national population, as well as Brisbane (9.85%), Adelaide (5.38%), Gold Coast (2.7%), ACT (1.8%), Sunshine Coast (1.33%), and Toowoomba (0.55%)
are within a days drive (with breaks) of Sydney and Melbourne. That adds up to around 79% of the national population in that catchment area.
Some basic rough modeling.
My opinion is that participation drops the longer the drive is, and drops precipitously if people have to drive for two days or more - and that most people are not up for driving 15 hours in one day.
So that is to say:
- Rebels are highly likely to attend a major mobilisation within their own city (let’s assume 99% - otherwise are they really a rebel?).
- They are very likely to attend a major mobilisation within 3 hours drive (let’s say 85%).
- They are pretty likely to attend a major mobilisation within one day’s drive (let’s say 50%).
- Some of them will make the effort to go as far as required (let’s say a generous estimate of 30%)
And let’s assume that the number of rebels in a place after our mobilisers have done their thing is proportional to the population.
I therefore think if we limit the 3rd wave to Sydney only, we would be cutting off significant amounts of participation due to the distance - Adelaide rebels would have a long way to go, and we’d be dropping participation.
Obviously this is a bit of a guesstimate - we could probably improve the model with more direct data by directly asking people what they would be willing to do as part of the pledge (@Mad_Mattho).
We can then plug in numbers of the populations in different catchment areas based on different plans.
Sydney Only
-
Rebel population of Sydney is highly likely to attend.
Sydney’s rebel population is 21% of the nation - 99% likely to attend. -
There are three major cities within 3 hours drive (Canberra, Wollongong, and Newcastle) - adding up to 1.95 + 1.83 + 1.21 = 5% that are 85% likely to attend.
-
The rest of the rebels in NSW are somewhere up to a days drive from Sydney. They make up 32% - 26% = 7% of rebels, and we’ll average them between 85% and 50% to be at 73% likelihood to attend (we could calculate this better using excel but for now it’s rough).
-
And Melbourne and half of the rest of Victoria are also about a day’s drive to Sydney, so we can add them in (25% of rebels) at 50% likelihood to attend.
-
Southeast Queensland (Brisbane, Gold Coast, Sunshine Coast and Toowoomba) are also about a day’s drive. They make up 9.85% + 2.72% + 1.33% + 0.55% = 14.45% of rebels - at 50% likelihood to attend.
-
The rest of the country - that’s 27.5% of the population - have a long trip to get to Sydney, and are 30% likely to attend.
Summarizing in a table it looks like this:
| Population Area | Proportion of Rebels | Likeliness | Percentage of Rebels Attending in Sydney |
|---|---|---|---|
| Greater Sydney | 0.21 | 0.99 | 0.2079 |
| Canberra, Wollongong, Newcastle | 0.05 | 0.85 | 0.0425 |
| Rest of NSW | 0.07 | 0.73 | 0.0511 |
| Melbourne and half of Victoria | 0.25 | 0.5 | 0.125 |
| Brisbane, Gold Coast, Sunshine Coast, Toowoomba | 0.145 | 0.5 | 0.0725 |
| Rest of country | 0.275 | 0.3 | 0.0825 |
| Total: | 0.5815 |
That is to say that around 58% of rebels would attend a major mobilisation in Sydney assuming the above likeliness values.
Sydney and Melbourne
If we mobilise to block both Sydney and Melbourne, the major changes are that far more people are within a target city, within 3 hours of a target city, or within a days drive of a target city.
A major addition to the catchment area is Adelaide with 5.4% of the population.
The table looks like this:
| Population Area | Proportion of Rebels | Likeliness | Percentage of Rebels Attending in Sydney |
|---|---|---|---|
| Greater Sydney & Greater Melbourne | 0.41 | 0.99 | 0.4059 |
| Canberra, Wollongong, Newcastle, Geelong, Ballarat, Bendigo | 0.07 | 0.85 | 0.0595 |
| Rest of NSW and Vic | 0.1 | 0.73 | 0.073 |
| Adelaide | 0.05 | 0.5 | 0.025 |
| Brisbane, Gold Coast, Sunshine Coast, Toowoomba | 0.145 | 0.5 | 0.0725 |
| Rest of country | 0.225 | 0.3 | 0.0675 |
| Total: | 0.7034 |
Under this scenario about 70% of rebels nationwide attend the mobilizations in Sydney and Melbourne.
Sydney, Melbourne and Perth
4 out of 5 West Australians live in Perth.
Here I’ve taken the above data and assumed that many Perthicans might not want to make the 3 day trip across country and instead try to block Perth, a major mining industry capital.
I haven’t changed things for other towns in WA - which would add up to maybe 0.5-1.5% of rebels who would have a shorter trip to go to Perth.
| Population Area | Proportion of Rebels | Likeliness | Percentage of Rebels Attending in Sydney |
|---|---|---|---|
| Greater Sydney & Greater Melbourne & Greater Perth | 0.49 | 0.99 | 0.4851 |
| Canberra, Wollongong, Newcastle, Geelong, Ballarat, Bendigo | 0.07 | 0.85 | 0.0595 |
| Rest of NSW and Vic | 0.1 | 0.73 | 0.073 |
| Adelaide | 0.05 | 0.5 | 0.025 |
| Brisbane, Gold Coast, Sunshine Coast, Toowoomba | 0.145 | 0.5 | 0.0725 |
| Rest of country | 0.145 | 0.3 | 0.0435 |
| Total: | 0.7586 |
So here we’d have 76% or so participation in a major mobilisation.
Summary of Scenario Impacts on Participation
| Scenario | Participation Estimate |
|---|---|
| Sydney Only | 58% |
| Sydney and Melbourne | 70% |
| Sydney, Melbourne and Perth | 76% |
These numbers would vary depending on how optimistic or pessimistic you are about rebels’ willingness to travel over land. If you are more pessimistic, it favours multiple targets more heavily. If you are optimistic, it improves the balance for hitting one place. Here’s how the numbers popped out when I modified the likelihood of rebels to travel based on distance.
| Scenario | Participation (Pessimistic of Willingness to Travel) | Participation (Optimistic of Willingness to Travel) |
|---|---|---|
| Sydney Only | 48% | 72% |
| Sydney and Melbourne | 62% | 80% |
| Sydney, Melbourne and Perth | 69% | 84% |
Any way you cut it, the bottom line is that a Sydney, Melbourne and Perth option has much higher participation.
We could also look at population clusters that are highly distant from the above targets and make plans that include rebels in those areas. Some conspicuous clusters are Tasmania, Central and North Queensland, and Darwin. A plan to cover these areas could include Tasmanians blocking logging, Queenslanders stopping Adani and coal trains, and Darwinians doing something to block fracking in the NT, for example. This could improve participation even further, getting us up to 80 or 90% participation.
The next major thing to consider after participation would be what we think our mobilisations might be able to achieve in the target cities. I’ll leave that for further consideration in another post.
4 Likes
If only for the purpose of consciously rejecting it, raising here the option of a wave 3 disruption in Canberra (or more specifically, prolonged shut down of Parliament House during a sitting week in November or December). This would be a political disruption rather than economic - but with the same outcome in mind, ie an action which forces Government to take notice and act. It could be ‘the’ disruption if it is seen as attractive and only one location is the decision. Another option would be for it to happen after wave 3 action(s) in one or more state CBDs (although by that stage, exhaustion may mean not getting sufficient numbers in Canberra). Anyway - possible food for thought.
2 Likes
I think the Canberra option lacks the impact of disrupting a major financial hub. I think the aim is to disrupt the economy and business as usual so as to force the government into repsonding. While politicians are in Canberra it is not a major business hub - so the financial disruption would be minimal and consequently the need for them to repsond would not be as acute. Of course people could do actions in Canberra - but that would not create the dilema action that a week long blockade of Melbourne and Sydney would. The theory is: disrupt business as usual and create maximum national socio-politcial tension so the entire country comes to a standstill and focuses on XR - we want to be the focus of national media attention for a week as occured in the UK in April 2019. Canberra is unlikely to be the place to achieve this.
1 Like
Yes - if the focus is on economic/financial disruption then Canberra is not a priority for AusMM - given it’s size and also, while lots of scope for improvement, the ACT government is way ahead of all other jurisdictions in terms of climate response (eg already 100% of electricity is from renewables and has strategy for phasing out gas) - so undertaking economic disruption in ACT could be seen as somewhat counterproductive. As noted in the original message, this would be a ‘political’ (rather than an economic/financial) disruption - shutting down and/or having mass arrests on capital hill would attract national media attention.
As indicated by plotinus, a main focus of XR internationally has been CBD disruption - and that may well be the best course of action for Australia - but given the flexibility inherent in XR DNA, we don’t have to explicitly follow this if it makes more sense here to do something different.
All that is being raised here, is that it is an option for consideration.
Before the Covid lockdown there was a national ‘Don’t Fund the Catastrophe’ XR action in the early planning stages for a mass mobilisation in Canberra with the aim for disrupting the May budget sitting. Maybe something to consider again for next year.
1 Like
Sydney Melbourne and Perth would have higher participation but lower impact Vs state intrements of power (cops, jails, watch houses). But a mobilisation in all state capitals would have higher participation again. I think we need to remember that we are about generating maximum leverage by putting the state under pressure, splitting resources.
to get government to crack we gotta overpower the police and watch houses below are police numbers per state, I can’t find watch house capacities but we can assume they are similar
NSW police- 21K
Vic police - 21k
QLD police -11
WA police - 6.7K
If we mobilise in Sydney alone its 58% of us (according to manicmax) vs 21k , If its Melbs and Sydney its 70% of us Vs 42k police and if Perth is included as well its 76% Vs almost 50k police.
I think what we also have to consider is that those people are who willing to travel are also probably most likley to we willing to risk arrest so the 58% might be smaller but it also will probably have a higher percentage of people willing to take part in DA. Also a central/national mobilisation is a single national mobilisation, splitting like kinda by definition makes it a decentralised mobilsation.
1 Like
What you say makes sense to me Plotinus
1 Like
I’m not well informed re XR strategy but my thoughts nevertheless…
One city is not a national action. It took the PM many weeks of bushfires around the country to call a national emergency and get involved. He has talked puff about dealing with environmental protesters, (and bagged the states for not dealing with things) but when push comes to shove it is state police force’s problem. How severe would the impost need to be for the C/w to actually get involved? In non-violent action? Short of blockading an event of international significance (G20?), I don’t see them getting materially involved.
The discussion so far seems to be focused on ‘what’s the best we can do’. Is that what ‘Wave 3’ means? Or is Wave 3 supposed to be ‘what would it take to win’?
If it’s about mass mobilisaton and building movement then local seems better to me. Better participation opportunities. Better media too? Though having a focus centre with escalated disruption would possibly be more media worthy and more inspiring. (Dunno, just thoughts out loud.)
If it’s an actual federal response that’s needed, it makes sense to me to envisage what would actually force Commonwealth action and work backwards. And don’t bother pushing go until the result is plausible. And be clear about the strategy at each stage. Which is probably quite a different conversation? (I am assuming there isn’t already a 5 year plan which spells this out…) But I feel like if there was a solid end-goal strategy then we’d have an answer to the present question already…
This sounds reasonable to me.
Yes the parliament has demonstrated this year that it’s happy not to meet if not convenient… But still, I feel like there needs to be at least a symbolic affront to the Commonwealth.
ESP if the relevant security forces answer to the Federal Government.
What about blockading MPs inside?
Or blockading a joint AUS-US hypersonic missile base?
1 Like
Amazing statistics and analysis to inform this decision! My two cents: Could be good to have Syd, Mel and Perth coordinated mass blockades for wave 3 given higher participation rates and the national support and pressure toward govts that would be garnered from those three cities shutting down
By this logic, we shouldn’t be mobilising to Sydney, but smaller cities with less police resources
Earlier discussion in this channel, arguing for Sydney or Melbourne rather than Canberra, emphasised the need for the disruption to be financial/economic rather than focusing directly on the political - highlighting the April 2019 disruption in London as an example. Interestingly here is what XR UK are planning for September:
“THE REBELLION GOES TO PARLIAMENT Beginning on 1 September, Extinction Rebellion will return. On that day the UK Parliament starts re-sitting after the summer: but we’re not going to let them back in until they agree to start anew with justice, care and life at the heart of it. From the 1st we will peacefully blockade the UK Parliament in London until they promise that the first thing they’ll do is debate our 3 demands.
The Rebellion will not just be focused on London though. Welsh Rebels will join us in Rebellion by causing disruption in Cardiff, with rebels in the North and Scotland formulating plans as we speak.”
2 Likes
Yes, this phase of action at UK Parliament is not equivalent in strategic intent to “wave 3”.
We have an unsolvable problem in Australia in that the economic centres and main population centres are not the seat of federal political power. So we can’t replicate the UK London strategy.
I just finished reading Rupert Read’s new book ‘Inside Extinction Rebellion’ and I think that he has some useful things to say. He has been a long-standing opponent of the ‘Shut down the CBD, cause massive disruption and cost and win’ approach. And he was surprised the April 2019 London Rebellion worked so well.
History has of course shown him wrong on this and I still think that disruption of CBDs (as recommended by Roger Hallam) is a worthwhile aim.
A week of less sustained disruption - mainly in Melbourne and Sydney - in October 2019 worked very well and was immediately followed by a 400,000 signature petition to Parliament calling for the declaration of a climate emergency (ie strong public support) and three climate emergency motions to Parliament (two to the lower house and one to the Senate) all narrowly lost. So I think a longer disruption in several (or all Australian state capitals is very worthwhile.
We will be trialling major disruption (or varying levels of disruption) as Wave 2 so that will give us a good idea of police responses, which cities are easier to disrupt, how many rebels will risk arrest etc. The hard bit is Wave 3 but maybe we don’t need to make a final decision till after we have the learnings from Wave 2, and possibly from some small to medium scale disruption of Parliament?
Anyway … returning to the Rupert Read book … RR doesn’t think the October wave of rebellion worked that well in London (and nor do I) - though whether there would have been a better result without the Camden Town tube action is hard to know. There was a lot of luck as well as judgement in the success of April and it was always going to be a challenge to make ‘more of the same’ work. So RR argues for a greater focus on Parliament and disrupting wealthy people rather than ordinary folks. Hence the London focus on Parliament in September. And on London Airport, rather than Heathrow. Will be interesting to see how the UK goes with this approach.
Mostly I’m a fan of more economic disruption + overwhelming the police etc = more chance of success, (as argued by Roger Hallam) but the thing that RR says that makes sense to me is that if you are going to disrupt ordinary people you need a good strong narrative explaining why you are doing it.
When I imagine Scott Morrison capitulating to our demands, I find it a lot easier to imagine as arising out of a long blockade, or a series of large disruptive actions, in and around Canberra. (But building on past disruption elsewhere.) And it seems to me that there are quite a number of ways of causing major disruption to politicians in Canberra even without huge numbers.
Probably we need a combination approach. I think we had it right in our planning for May 2020 (sadly cancelled due to the pandemic): major sustained disruption in as many state capitals as possible and then a convergence of a relatively small number of the highly motivated on Canberra during a sitting week (ideally budget week or some other high profile sitting week).
That way the public narrative is ‘look how we have been forced to shut down major cities and cause disruption to force our broken system to act on this emergency - this disruption is a message for the (state and?) federal government(s) and in two weeks time we will be in Canberra to deliver this message to Parliament’.
3 Likes
Reposting another rebel’s comment from our facebook discussion group in case anyone finds it interesting:
"This potentially begins to take things to another level in these protests.
‘Potentially’ in that the strikes are still small, and may be easily suppressed.
‘Another level’ in that the greatest lever of the oppressed is the ability to deny profits.
XR has tried to do that in particular ways - by blocking roads and so forth. It has its costs to XR, and the costs to the ruling class are indirect.
Are we, as XR ACT people, aware of the legal structures that make it so difficult for Australian workers to take such action, be it in support of BLM or in support of climate action?
If we are talking about building alliances, it is important that we come to understand such dynamics.

1 Like
Two questions in response to this -
Q1 how can we be more inclusive of people who have to travel for a national action?
Q2 do we want to optimising only to participation rates or to non-violent disruption overall?
Further to Q1 is that if people are only participating 50% or 30% for the national action, what is the major blocker to them, and how can we lift this up to 85%-90%?
If people travel for relaxation, major cultural events, and other ‘relatively trivial’ causes - what are we doing wrong that we can’t assume they will travel for survival?
I would like it if we could organise effective community support to make us as inclusive as possible regarding distance:
- a financial pledge to equalise travel expenses so that people who happen to be a long way away can still come
- logistic organisation around buses or vans, drivers, routes and people who need lifts.
Further to Q2, if we take the logical extreme in optimising only on participation rates, we end up not doing a national action at all and have many local group doing road waves.
The equation needs to be driven off non-violent disruption overall, and we need to be doing everything we can to make the national action inclusive to people who are remote.
1 Like
‘As you’re not doing your job - the citizens of Australia will do it for you.’ Perhaps the Canberra lock down could be special 3rd demand Citizens’ Assembly Action. Block the Government from doing their job - because they’re not doing their job. Blockade them out and stage a theatrical Citizens’ Assembly - complete with speeches by international experts and a randomly picked jury.
4 Likes
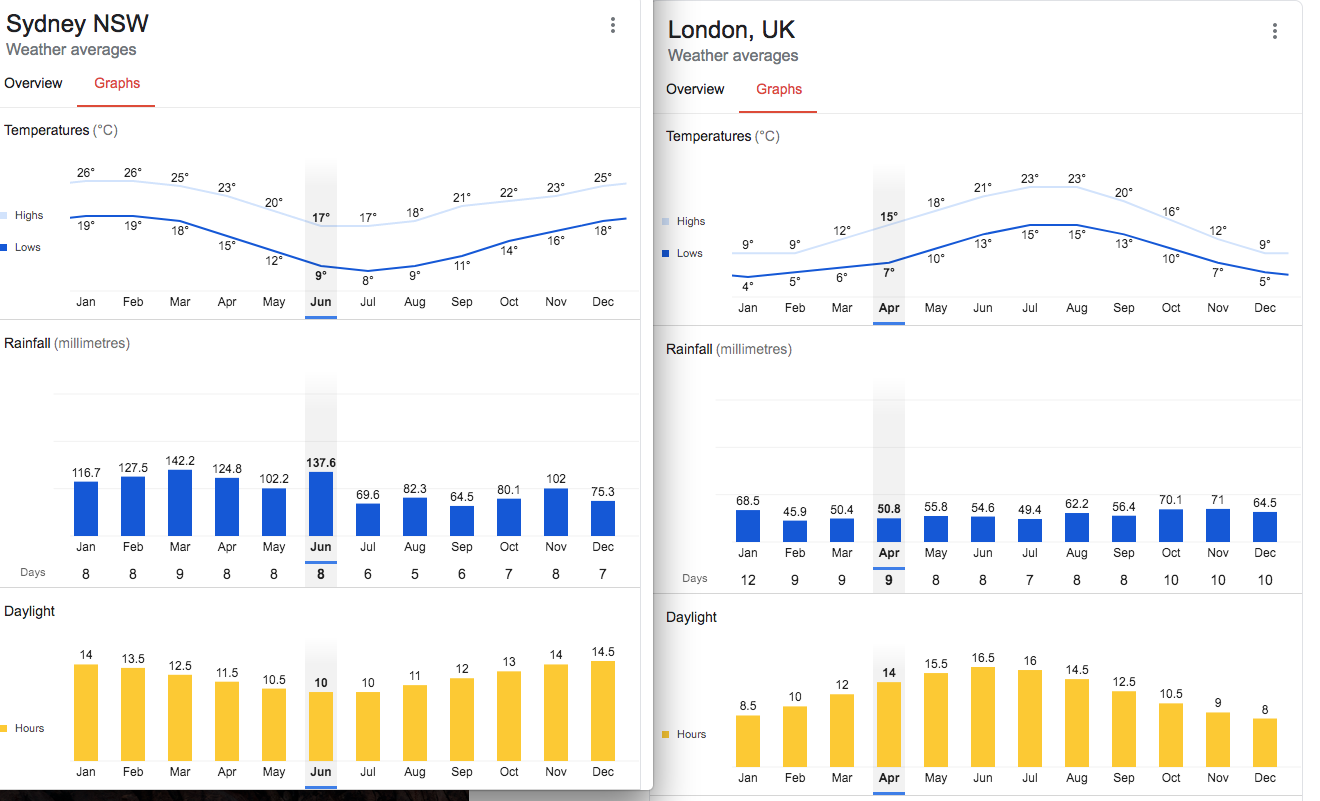
WEATHER
Seeing as we have wave 2 big actions (hopefully multiple day long) coming up on March 22 - it follows that about 3-4 months later we should be mobilising again.
I was thinking, ok Sydney in July… that’s the middle of winter. But what is interesting to realise is that July weather in Sydney is comparable to April weather in London. The biggest difference is 4 hours less daylight. My point is that, thankfully, for now, we are blessed with bloody nice weather in Sydney in winter. Probably relatively perfect weather in fact. So… just putting it out there that a mass mobilisation in Sydney could take place in July/August - based on weather that is 
Agree. What are the thoughts also on inviting rebels from WA and TAS or even Adelaide to say, fly to Sydney for it? It is (or used to be) the cheapest travel option, and obviously quick (time=money) but is it too blatantly hypocritical? Alternatively a suggestion is that convoys drive slowly along the highways towards Sydney in the lead up to the event. That could cause big news… “A slow drive to Sydney will be taking place as members of … make their way for what they are calling a MASS DISRUPTION of the broken economic system”… That could be very cool IMO