I think we should take into account a balance of factors here. Here I’ve played with a bunch of the data to look at how different targeting scenarios might impact participation.
Data
Here’s Australia’s population listed by State / Territory (not counting overseas territories):
| State |
Postal |
Capital |
Population |
Percentage |
Cumulative |
|
|
|
(Jun 2019)[3] |
|
|
| New South Wales |
NSW |
Sydney |
8,089,526 |
31.899% |
31.899% |
| Victoria |
VIC |
Melbourne |
6,594,804 |
26.005% |
57.903% |
| Queensland |
QLD |
Brisbane |
5,095,100 |
20.091% |
77.994% |
| Western Australia |
WA |
Perth[n 2] |
2,621,680 |
10.338% |
88.332% |
| South Australia |
SA |
Adelaide |
1,751,693 |
6.907% |
95.240% |
| Tasmania |
TAS |
Hobart |
534,281 |
2.107% |
97.346% |
| Australian Capital Territory |
ACT |
Canberra |
426,709 |
1.683% |
99.029% |
| Northern Territory |
NT |
Darwin |
245,869 |
0.970% |
99.998% |
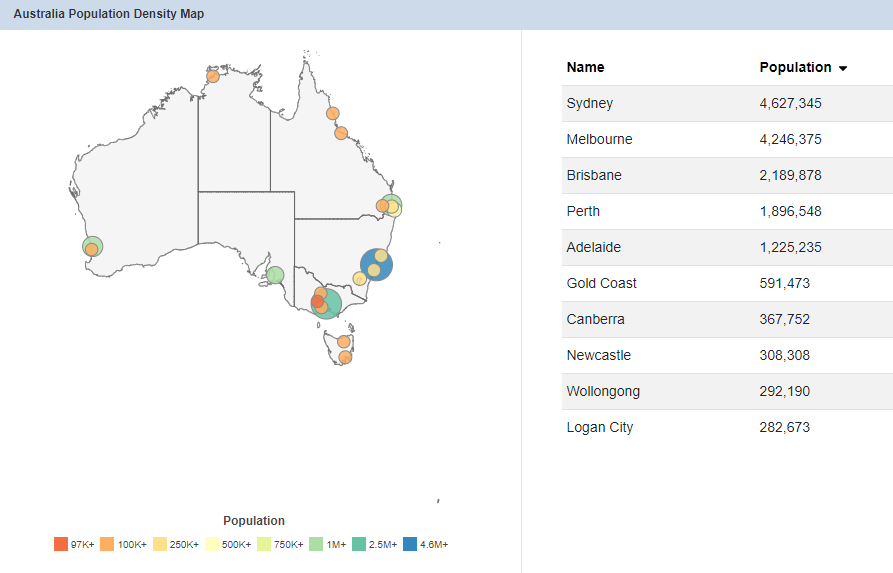
Here’s a map of Australian population centers:
And here’s a list of urban population centers with a population over 10,000 from Wikipedia (data from June 2018 Census):
| Rank |
GCCSA/SUA |
State/Territory |
June 2018[2] |
2011 Census[3] |
Growth |
Percentage of |
Cumulative Percentage |
|
|
|
|
Population |
|
national population (June 2018) |
|
| 1 |
Sydney |
New South Wales |
5,230,330 |
4,391,674 |
19.10% |
20.93% |
20.93% |
| 2 |
Melbourne |
Victoria |
4,936,349 |
3,999,982 |
24.08% |
19.86% |
40.79% |
| 3 |
Brisbane |
Queensland |
2,462,637 |
2,065,996 |
19.20% |
9.85% |
50.64% |
| 4 |
Perth |
Western Australia |
2,059,484 |
1,728,867 |
19.12% |
8.24% |
58.88% |
| 5 |
Adelaide |
South Australia |
1,345,777 |
1,262,940 |
6.56% |
5.38% |
64.26% |
| 6 |
Gold Coast–Tweed Heads |
Queensland/New South Wales |
679,127 |
557,822 |
21.75% |
2.72% |
66.98% |
| 7 |
Newcastle–Maitland |
New South Wales |
486,704 |
398,770 |
22.05% |
1.95% |
68.93% |
| 8 |
Canberra–Queanbeyan |
Australian Capital Territory/New South Wales |
457,563 |
391,645 |
16.83% |
1.83% |
70.76% |
| 9 |
Sunshine Coast |
Queensland |
333,436 |
270,770 |
23.14% |
1.33% |
72.09% |
| 10 |
Wollongong |
New South Wales |
302,739 |
268,944 |
12.57% |
1.21% |
73.30% |
| 11 |
Geelong |
Victoria |
268,277 |
173,454 |
54.67% |
1.07% |
74.37% |
| 12 |
Hobart |
Tasmania |
232,606 |
211,656 |
9.90% |
0.93% |
75.30% |
| 13 |
Townsville |
Queensland |
180,820 |
162,292 |
11.42% |
0.72% |
76.02% |
| 14 |
Cairns |
Queensland |
152,729 |
133,911 |
14.05% |
0.61% |
76.63% |
| 15 |
Darwin |
Northern Territory |
148,564 |
120,586 |
23.20% |
0.59% |
77.22% |
| 16 |
Toowoomba |
Queensland |
136,861 |
105,984 |
29.13% |
0.55% |
77.77% |
| 17 |
Ballarat |
Victoria |
105,471 |
91,801 |
14.89% |
0.42% |
78.19% |
| 18 |
Bendigo |
Victoria |
99,122 |
86,079 |
15.15% |
0.40% |
78.59% |
| 19 |
Albury–Wodonga |
New South Wales/Victoria |
93,603 |
82,083 |
14.03% |
0.37% |
78.96% |
| 20 |
Launceston |
Tasmania |
87,382 |
82,220 |
6.21% |
0.35% |
79.31% |
| 21 |
Mackay |
Queensland |
80,148 |
77,293 |
3.69% |
0.32% |
79.63% |
| 22 |
Rockhampton |
Queensland |
78,592 |
73,681 |
6.67% |
0.31% |
79.94% |
| 23 |
Bunbury |
Western Australia |
74,363 |
65,608 |
13.34% |
0.30% |
80.24% |
| 24 |
Coffs Harbour |
New South Wales |
71,822 |
64,243 |
11.80% |
0.29% |
80.53% |
| 25 |
Bundaberg |
Queensland |
70,921 |
67,341 |
5.32% |
0.28% |
80.81% |
| 26 |
Wagga Wagga |
New South Wales |
56,442 |
52,042 |
8.45% |
0.23% |
81.04% |
| 27 |
Hervey Bay |
Queensland |
54,674 |
48,680 |
12.31% |
0.22% |
81.26% |
| 28 |
Mildura–Wentworth |
Victoria/New South Wales |
51,903 |
47,536 |
9.19% |
0.21% |
81.47% |
| 29 |
Shepparton–Mooroopna |
Victoria |
51,631 |
46,505 |
11.02% |
0.21% |
81.68% |
| 30 |
Port Macquarie |
New South Wales |
47,973 |
41,723 |
14.98% |
0.19% |
81.87% |
| 31 |
Gladstone–Tannum Sands |
Queensland |
45,130 |
41,966 |
7.54% |
0.18% |
82.05% |
| 32 |
Tamworth |
New South Wales |
42,872 |
38,735 |
10.68% |
0.17% |
82.22% |
| 33 |
Traralgon–Morwell |
Victoria |
41,984 |
39,705 |
5.74% |
0.17% |
82.39% |
| 34 |
Orange |
New South Wales |
40,493 |
36,468 |
11.04% |
0.16% |
82.55% |
| 35 |
Bowral–Mittagong |
New South Wales |
39,887 |
34,858 |
14.43% |
0.16% |
82.71% |
| 36 |
Busselton |
Western Australia |
38,921 |
30,286 |
28.51% |
0.16% |
82.87% |
| 37 |
Dubbo |
New South Wales |
38,392 |
33,997 |
12.93% |
0.15% |
83.02% |
| 38 |
Warragul–Drouin |
Victoria |
37,928 |
29,944 |
26.66% |
0.15% |
83.17% |
| 39 |
Geraldton |
Western Australia |
37,648 |
35,749 |
5.31% |
0.15% |
83.32% |
| 40 |
Nowra–Bomaderry |
New South Wales |
37,420 |
33,338 |
12.24% |
0.15% |
83.47% |
| 41 |
Bathurst |
New South Wales |
36,801 |
32,479 |
13.31% |
0.15% |
83.62% |
| 42 |
Warrnambool |
Victoria |
35,214 |
32,380 |
8.75% |
0.14% |
83.76% |
| 43 |
Albany |
Western Australia |
34,205 |
30,656 |
11.58% |
0.14% |
83.90% |
| 44 |
Devonport |
Tasmania |
30,297 |
29,051 |
4.29% |
0.12% |
84.02% |
| 45 |
Kalgoorlie–Boulder |
Western Australia |
29,849 |
30,842 |
−3.22% |
0.12% |
84.14% |
| 46 |
Mount Gambier |
South Australia |
29,639 |
27,756 |
6.78% |
0.12% |
84.26% |
| 47 |
Lismore |
New South Wales |
28,720 |
28,285 |
1.54% |
0.11% |
84.37% |
| 48 |
Nelson Bay |
New South Wales |
28,051 |
25,074 |
11.87% |
0.11% |
84.48% |
| 49 |
Maryborough |
Queensland |
27,282 |
26,214 |
4.07% |
0.11% |
84.59% |
| 50 |
Burnie–Wynyard |
Tasmania |
27,174 |
26,869 |
1.15% |
0.11% |
84.70% |
| 51 |
Alice Springs |
Northern Territory |
26,534 |
25,186 |
5.35% |
0.11% |
84.81% |
| 52 |
Victor Harbor–Goolwa |
South Australia |
26,532 |
23,850 |
11.25% |
0.11% |
84.92% |
| 53 |
Ballina |
New South Wales |
26,381 |
23,509 |
12.22% |
0.11% |
85.03% |
| 54 |
Taree |
New South Wales |
26,381 |
25,421 |
3.78% |
0.11% |
85.14% |
| 55 |
Morisset–Cooranbong |
New South Wales |
25,309 |
21,774 |
16.23% |
0.10% |
85.24% |
| 56 |
Armidale |
New South Wales |
24,504 |
22,464 |
9.08% |
0.10% |
85.34% |
| 57 |
Goulburn |
New South Wales |
23,835 |
21,484 |
10.94% |
0.10% |
85.44% |
| 58 |
Whyalla |
South Australia |
21,742 |
21,991 |
−1.13% |
0.09% |
85.53% |
| 59 |
Gympie |
Queensland |
21,599 |
19,510 |
10.71% |
0.09% |
85.62% |
| 60 |
Echuca–Moama |
Victoria |
21,242 |
19,309 |
10.01% |
0.08% |
85.70% |
| 61 |
Forster–Tuncurry |
New South Wales |
21,159 |
19,500 |
6.51% |
0.08% |
85.78% |
| 62 |
Griffith |
New South Wales |
20,251 |
17,900 |
13.13% |
0.08% |
85.86% |
| 63 |
Wangaratta |
Victoria |
19,318 |
17,686 |
9.23% |
0.08% |
85.94% |
| 64 |
St Georges Basin–Sanctuary Point |
New South Wales |
19,251 |
12,611 |
52.65% |
0.08% |
86.02% |
| 65 |
Grafton |
New South Wales |
19,078 |
18,359 |
3.92% |
0.08% |
86.10% |
| 66 |
Yeppoon |
Queensland |
19,003 |
16,372 |
16.07% |
0.08% |
86.18% |
| 67 |
Murray Bridge |
South Australia |
18,779 |
16,708 |
12.40% |
0.08% |
86.26% |
| 68 |
Mount Isa |
Queensland |
18,588 |
20,569 |
−9.63% |
0.07% |
86.33% |
| 69 |
Camden Haven |
New South Wales |
17,835 |
15,741 |
13.30% |
0.07% |
86.40% |
| 70 |
Broken Hill |
New South Wales |
17,734 |
18,517 |
−4.23% |
0.07% |
86.47% |
| 71 |
Moe–Newborough |
Victoria |
16,812 |
16,674 |
0.83% |
0.07% |
86.54% |
| 72 |
Karratha |
Western Australia |
16,708 |
16,476 |
1.41% |
0.07% |
86.61% |
| 73 |
Horsham |
Victoria |
16,514 |
15,894 |
3.90% |
0.07% |
86.68% |
| 74 |
Batemans Bay |
New South Wales |
16,485 |
15,733 |
4.78% |
0.07% |
86.75% |
| 75 |
Singleton |
New South Wales |
16,346 |
16,135 |
1.31% |
0.07% |
86.82% |
| 76 |
Port Lincoln |
South Australia |
16,326 |
15,221 |
7.26% |
0.07% |
86.89% |
| 77 |
Ulladulla |
New South Wales |
16,213 |
14,149 |
14.59% |
0.06% |
86.95% |
| 78 |
Bairnsdale |
Victoria |
15,411 |
13,243 |
16.37% |
0.06% |
87.01% |
| 79 |
Warwick |
Queensland |
15,380 |
14,607 |
5.29% |
0.06% |
87.07% |
| 80 |
Kempsey |
New South Wales |
15,309 |
14,494 |
5.62% |
0.06% |
87.13% |
| 81 |
Sale |
Victoria |
15,021 |
14,258 |
5.35% |
0.06% |
87.19% |
| 82 |
Ulverstone |
Tasmania |
14,490 |
14,109 |
2.70% |
0.06% |
87.25% |
| 83 |
Broome |
Western Australia |
14,445 |
12,766 |
13.15% |
0.06% |
87.31% |
| 84 |
Port Hedland |
Western Australia |
14,320 |
13,772 |
3.98% |
0.06% |
87.37% |
| 85 |
Port Pirie |
South Australia |
14,188 |
14,043 |
1.03% |
0.06% |
87.43% |
| 86 |
Emerald |
Queensland |
14,119 |
13,219 |
6.81% |
0.06% |
87.49% |
| 87 |
Port Augusta |
South Australia |
13,799 |
13,658 |
1.03% |
0.06% |
87.55% |
| 88 |
Lithgow |
New South Wales |
12,973 |
12,249 |
5.91% |
0.05% |
87.60% |
| 89 |
Colac |
Victoria |
12,547 |
11,778 |
6.53% |
0.05% |
87.65% |
| 90 |
Mudgee |
New South Wales |
12,410 |
10,483 |
18.38% |
0.05% |
87.70% |
| 91 |
Muswellbrook |
New South Wales |
12,364 |
11,791 |
4.86% |
0.05% |
87.75% |
| 92 |
Esperance |
Western Australia |
12,145 |
11,432 |
6.24% |
0.05% |
87.80% |
| 93 |
Parkes |
New South Wales |
11,224 |
10,941 |
2.59% |
0.04% |
87.84% |
| 94 |
Swan Hill |
Victoria |
11,103 |
10,430 |
6.45% |
0.04% |
87.88% |
| 95 |
Portland |
Victoria |
10,900 |
10,715 |
1.73% |
0.04% |
87.92% |
| 96 |
Kingaroy |
Queensland |
10,398 |
9,808 |
6.02% |
0.04% |
87.96% |
I added the last column onto that chart, to give a bit of an indication how much of the national population has been accounted for as you scroll down the chart. You can see that once you’ve counted the first 20 or so cities you really start to see smaller and smaller gains, with almost 80% of the national population situated within the top 20 urban centers. From the 21st city onwards you to the 96th (Kingaroy, population 10,398), you have 8.3% of the national population, and over half of that are in NSW or Victoria.
Now, of those top 20, all are within 11 hours drive of Sydney and Melbourne with the exception of Perth, Hobart, Townsville, Cairns, Darwin, and Launceston.
So, from all of this, we can say that all of NSW and Vic (57% of national population, as well as Brisbane (9.85%), Adelaide (5.38%), Gold Coast (2.7%), ACT (1.8%), Sunshine Coast (1.33%), and Toowoomba (0.55%)
are within a days drive (with breaks) of Sydney and Melbourne. That adds up to around 79% of the national population in that catchment area.
Some basic rough modeling.
My opinion is that participation drops the longer the drive is, and drops precipitously if people have to drive for two days or more - and that most people are not up for driving 15 hours in one day.
So that is to say:
- Rebels are highly likely to attend a major mobilisation within their own city (let’s assume 99% - otherwise are they really a rebel?).
- They are very likely to attend a major mobilisation within 3 hours drive (let’s say 85%).
- They are pretty likely to attend a major mobilisation within one day’s drive (let’s say 50%).
- Some of them will make the effort to go as far as required (let’s say a generous estimate of 30%)
And let’s assume that the number of rebels in a place after our mobilisers have done their thing is proportional to the population.
I therefore think if we limit the 3rd wave to Sydney only, we would be cutting off significant amounts of participation due to the distance - Adelaide rebels would have a long way to go, and we’d be dropping participation.
Obviously this is a bit of a guesstimate - we could probably improve the model with more direct data by directly asking people what they would be willing to do as part of the pledge (@Mad_Mattho).
We can then plug in numbers of the populations in different catchment areas based on different plans.
Sydney Only
-
Rebel population of Sydney is highly likely to attend.
Sydney’s rebel population is 21% of the nation - 99% likely to attend.
-
There are three major cities within 3 hours drive (Canberra, Wollongong, and Newcastle) - adding up to 1.95 + 1.83 + 1.21 = 5% that are 85% likely to attend.
-
The rest of the rebels in NSW are somewhere up to a days drive from Sydney. They make up 32% - 26% = 7% of rebels, and we’ll average them between 85% and 50% to be at 73% likelihood to attend (we could calculate this better using excel but for now it’s rough).
-
And Melbourne and half of the rest of Victoria are also about a day’s drive to Sydney, so we can add them in (25% of rebels) at 50% likelihood to attend.
-
Southeast Queensland (Brisbane, Gold Coast, Sunshine Coast and Toowoomba) are also about a day’s drive. They make up 9.85% + 2.72% + 1.33% + 0.55% = 14.45% of rebels - at 50% likelihood to attend.
-
The rest of the country - that’s 27.5% of the population - have a long trip to get to Sydney, and are 30% likely to attend.
Summarizing in a table it looks like this:
| Population Area |
Proportion of Rebels |
Likeliness |
Percentage of Rebels Attending in Sydney |
| Greater Sydney |
0.21 |
0.99 |
0.2079 |
| Canberra, Wollongong, Newcastle |
0.05 |
0.85 |
0.0425 |
| Rest of NSW |
0.07 |
0.73 |
0.0511 |
| Melbourne and half of Victoria |
0.25 |
0.5 |
0.125 |
| Brisbane, Gold Coast, Sunshine Coast, Toowoomba |
0.145 |
0.5 |
0.0725 |
| Rest of country |
0.275 |
0.3 |
0.0825 |
|
|
Total: |
0.5815 |
That is to say that around 58% of rebels would attend a major mobilisation in Sydney assuming the above likeliness values.
Sydney and Melbourne
If we mobilise to block both Sydney and Melbourne, the major changes are that far more people are within a target city, within 3 hours of a target city, or within a days drive of a target city.
A major addition to the catchment area is Adelaide with 5.4% of the population.
The table looks like this:
| Population Area |
Proportion of Rebels |
Likeliness |
Percentage of Rebels Attending in Sydney |
| Greater Sydney & Greater Melbourne |
0.41 |
0.99 |
0.4059 |
| Canberra, Wollongong, Newcastle, Geelong, Ballarat, Bendigo |
0.07 |
0.85 |
0.0595 |
| Rest of NSW and Vic |
0.1 |
0.73 |
0.073 |
| Adelaide |
0.05 |
0.5 |
0.025 |
| Brisbane, Gold Coast, Sunshine Coast, Toowoomba |
0.145 |
0.5 |
0.0725 |
| Rest of country |
0.225 |
0.3 |
0.0675 |
|
|
Total: |
0.7034 |
Under this scenario about 70% of rebels nationwide attend the mobilizations in Sydney and Melbourne.
Sydney, Melbourne and Perth
4 out of 5 West Australians live in Perth.
Here I’ve taken the above data and assumed that many Perthicans might not want to make the 3 day trip across country and instead try to block Perth, a major mining industry capital.
I haven’t changed things for other towns in WA - which would add up to maybe 0.5-1.5% of rebels who would have a shorter trip to go to Perth.
| Population Area |
Proportion of Rebels |
Likeliness |
Percentage of Rebels Attending in Sydney |
| Greater Sydney & Greater Melbourne & Greater Perth |
0.49 |
0.99 |
0.4851 |
| Canberra, Wollongong, Newcastle, Geelong, Ballarat, Bendigo |
0.07 |
0.85 |
0.0595 |
| Rest of NSW and Vic |
0.1 |
0.73 |
0.073 |
| Adelaide |
0.05 |
0.5 |
0.025 |
| Brisbane, Gold Coast, Sunshine Coast, Toowoomba |
0.145 |
0.5 |
0.0725 |
| Rest of country |
0.145 |
0.3 |
0.0435 |
|
|
Total: |
0.7586 |
So here we’d have 76% or so participation in a major mobilisation.
Summary of Scenario Impacts on Participation
| Scenario |
Participation Estimate |
| Sydney Only |
58% |
| Sydney and Melbourne |
70% |
| Sydney, Melbourne and Perth |
76% |
These numbers would vary depending on how optimistic or pessimistic you are about rebels’ willingness to travel over land. If you are more pessimistic, it favours multiple targets more heavily. If you are optimistic, it improves the balance for hitting one place. Here’s how the numbers popped out when I modified the likelihood of rebels to travel based on distance.
| Scenario |
Participation (Pessimistic of Willingness to Travel) |
Participation (Optimistic of Willingness to Travel) |
| Sydney Only |
48% |
72% |
| Sydney and Melbourne |
62% |
80% |
| Sydney, Melbourne and Perth |
69% |
84% |
Any way you cut it, the bottom line is that a Sydney, Melbourne and Perth option has much higher participation.
We could also look at population clusters that are highly distant from the above targets and make plans that include rebels in those areas. Some conspicuous clusters are Tasmania, Central and North Queensland, and Darwin. A plan to cover these areas could include Tasmanians blocking logging, Queenslanders stopping Adani and coal trains, and Darwinians doing something to block fracking in the NT, for example. This could improve participation even further, getting us up to 80 or 90% participation.
The next major thing to consider after participation would be what we think our mobilisations might be able to achieve in the target cities. I’ll leave that for further consideration in another post.