Base health check, by the numbers
First, a glossary of the metrics.
-
Consolidated Pageviews: The number of page views for logged in users (dark blue), anonymous users (light blue), and crawlers (orange).
-
Signups: New accounts registered.
-
Topics: New topics posted.
-
Posts: The number of new posts made.
-
DAU/MAU: The number of users logged in that day, divided by the number of users logged in in the last month. Indicates community “stickiness”, or how many people who visit the Base keep coming back to check on it. Discourse advises to aim for 30% or more for a healthy community
-
Daily engaged users: Number of users who have liked or posted in the last day.
-
New contributors: Number of users who have joined the Base
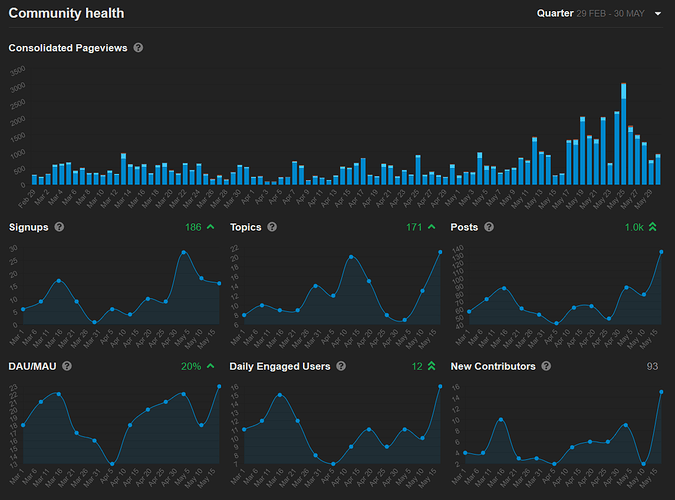
The last quarter, 29th Feb 2020 to 30 May 2020
Here we can see that after going through a bit of a lull in March, we’ve had a surge in signups, topics and posts in late April and May. The DAU/MAU community “stickiness” factor rose from an average of 17.1% in the last quarter to 19.6% in this quarter.
The last month, 30th April to 30th May 2020
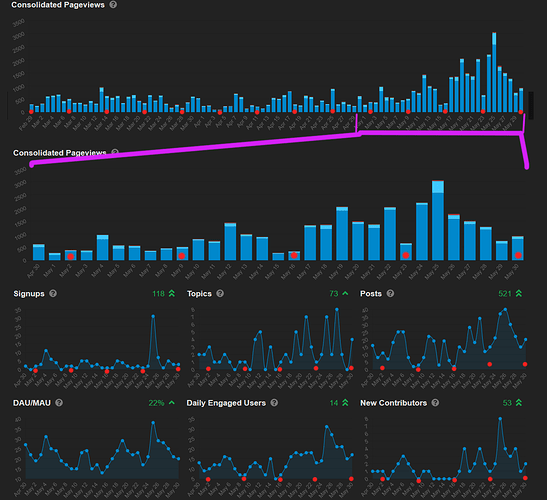
The first graph shows the whole quarter. The last month is highlighted within the purple brackets and expanded on below with all indicators shown.
I have marked the saturdays with a red dot, to demonstrate that there seems to be a weekly cycle in use of the Base, with troughs on fridays and saturdays and peaks during the week.
In this last month there have been huge increases in the number of new signups, posts, daily engaged users and new contributors. New contributors is about half the people who sign up, and stickiness is going up. I would probably attribute most of this to the awareness brought to the use of the Base by Paint the Streets, and to organizers in various states becoming aware and bringing other rebels along.
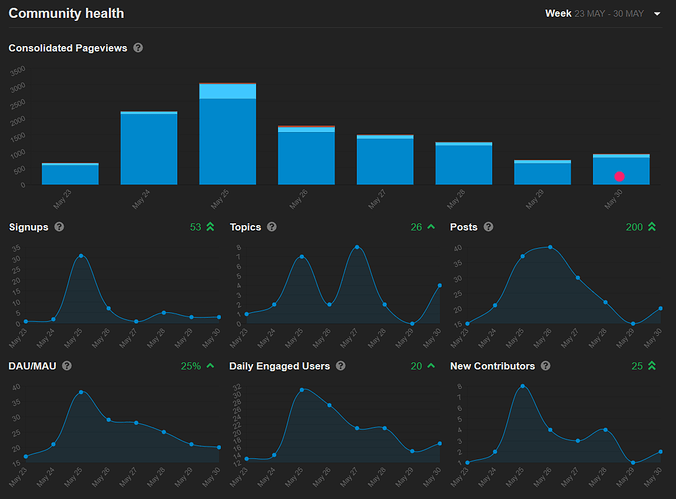
The last week, 23rd May to 30th May 2020
Here we see that almost half the signups, posts and new contributors in the last month were in the last week. This would seem to indicate the Base is rapidly growing.
We should probably move to onboard a few more admins from various states to help out with the job of moderating posts, creating new categories and helping with technical tasks.
Other indicators
Flagged posts for antisocial behaviour: There have been no complaints of user behaviour during any of this time. This is a major contrast to my experience with the Facebook group “Extinction Rebellion Vic Discussion” which needs almost constant monitoring by group admins to watch out for flamewars, spam and other nasty stuff. The Base is still quite a bit smaller than that group, but it is good to see that users are very well behaved here.
Flagged posts for other issues: In the last month 9 posts have been flagged for moderator review:
| Why |
Result |
| Question about how to link directly to a post. |
Question answered |
| Report that emails from the Base were failing domain name authentication. |
Reporter made aware that the issue was known and was waiting to be fixed by the IT team. |
| Request to remove references to Zoom from first steps topics. |
Rationale for zoom remaining (for now) explained to requester. Explanation posted publically here. |
| Automated flag because of an IT team account testing a script which typed it’s first post suspiciously fast. |
No action. |
| Request to change username. |
Support offered. |
| Request that user could not progress past introductory steps. |
No error found, user directed to categories page and was able to progress. |
| 2 reports that users were still seeing message that they had not joined their local group, while their local group was not available. |
1 had local group added for them. The other is a recent request pending completion (needs local group added). |

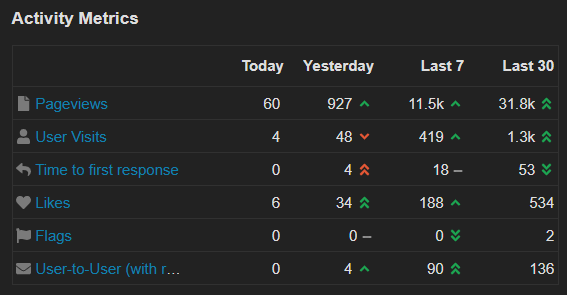
These metrics above are shown in terms of today, yesterday, the last 7 days and the last 30 days.
In this case “yesterday” is saturday the 30th of May - and we know that Saturdays are in general “low use” days. Note the dropping “Time to first response” indicator which is the average amount of hours for a new topic to have it’s first reply. This was 342 hours in April, and is now down to less than a day.
 Summary :
 Objectives:
 : Tasks :


